Personally speaking, I don’t have enough statistical education before, so I decide to study/review statistics again and go a little bit deeper to support my further IT study. In this post, I am going to introduce some basic factors of a data set.
Forms of Presentation
Data set is a concept, so that we cannot analyze or observe it directly. We need to transfer it into a or some specific forms to handle.
List/Table
The easiest way to show a data set is to list all elements in the set.
| index | value |
|---|---|
| 1 | 60 |
| 2 | 65 |
| 3 | 67 |
| 4 | 67 |
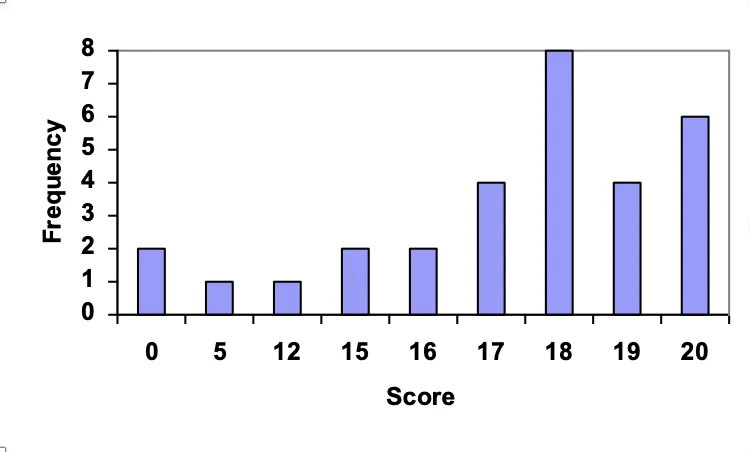
Bar Chart
When the data set contains a large amount of data, bar chart can show items and their frequencies.
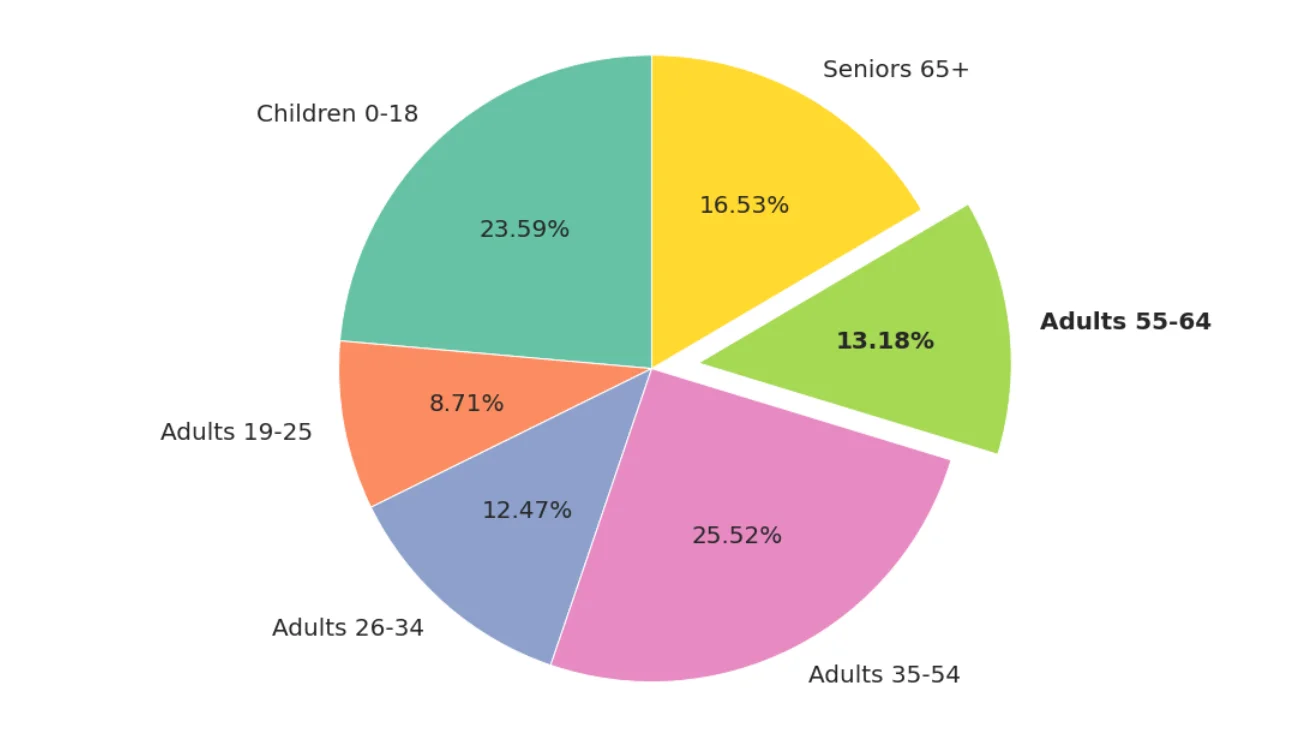
Pie Chart
Pie chart can show the percentage of each item. If you want percentages, then use pie chart.
Middle of the Data Set
Usually, data statistics start from the middle of the data set. There are three indexes to measure the middle of the data set.
Means
Average number
$$ \bar{x} = \frac{x1+x2+…+xn}{n} $$
For example, for a data set {1,2,3,5,6,6,7} $$ \bar{x} = \frac{1+2+3+5+6+6+7}{7} = 4.285… $$
Middle
Order the data set, and find the middle one. If the quantity of data items in data set is an even number, then calculate the average number of two middle number.
For a data set {1,2,3,5,6,6,7}, the middle data item is 5.
For a data set {1,2,3,5,6,7}, the middle data item is (3+5)/2 = 4.
Mode
data that occurs for the most times
For a data set {1,2,3,5,6,6,7}, the mode is 6.
Distribution of Data Set
However, even two data sets that have the same means/middle numbers/modes might not be the same data set because the distribution of data might be different. There are three kinds of indicators to measure distribution conditions.
Range
Range shows the range of data variation.
$$ Range = max - min $$
Standard Deviation
Standard deviation can be used to measure the gap between elements. The larger standard deviation, the larger gap.
$$ \sigma = \frac{1}{n-1} \sum_{i=1}^{n}(x_i - \bar{x})^2 $$
Important: if two data sets refer to different things, then their standard deviation cannot be compared directly!
Data set 1: it’s temperatures within one day, and its standard deviation is 20. Data set 2: it’s salaries of teachers, and its standard deviation is 100. Even the deviation of second data set is bigger than first’s, but according to common knowledge, we know 10℃ gap in temperature within one day is huge gap and 100 in salaries is not a big gap. That’s why when two data set refer to different things, they cannot be compared.
Z-score
Z-score is a measure of how many standard deviations a data point is away from the mean of a distribution.
$$ z = \frac{x-\bar{x}}{\sigma} $$
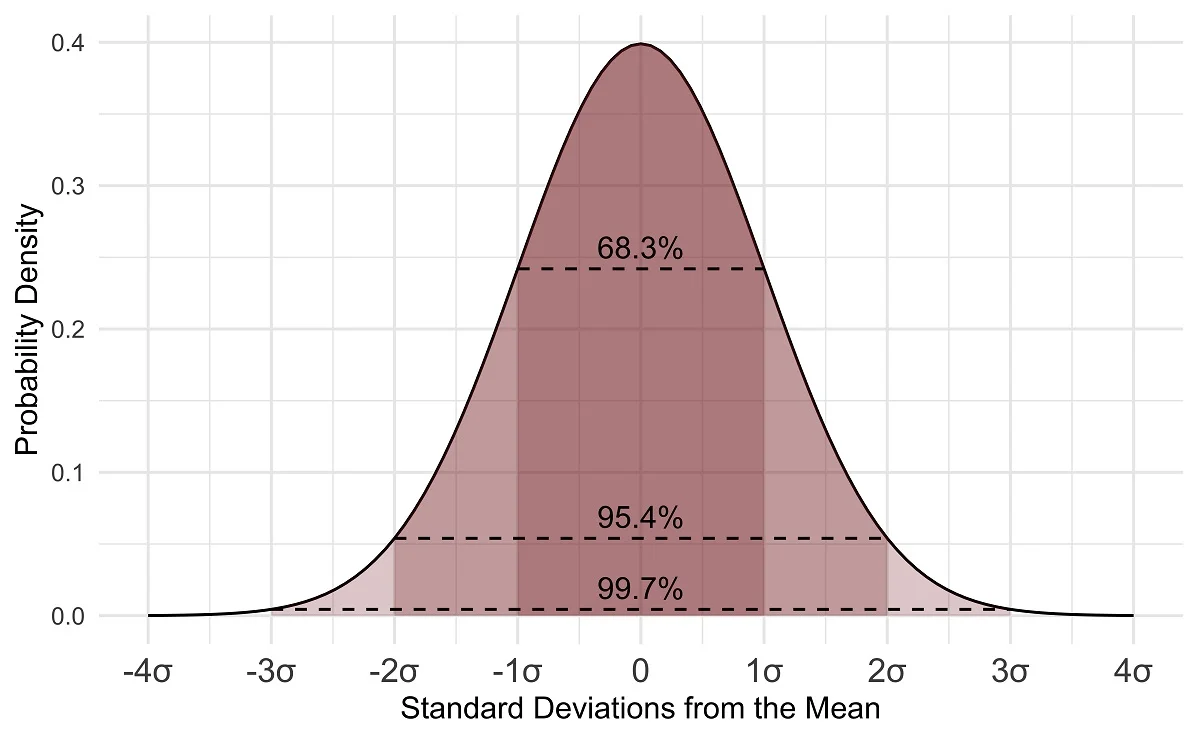
In normally distributed data:
1σ: This refers to one standard deviation away from the mean in both the positive and negative directions. In a normal distribution, about 68% of the data falls within 1σ from the mean.
2σ: This refers to two standard deviations away from the mean in both the positive and negative directions. In a normal distribution, about 95% of the data falls within 2σ from the mean.
3σ: This refers to three standard deviations away from the mean in both the positive and negative directions. In a normal distribution, about 99.7% of the data falls within 3σ from the mean. This range is often used to identify outliers in the data.
Important: outliers do not mean the data that should be ignored. In fact, there is no specific concept indicating what is outlier and how to deal with it. There might be some truths or implict trends hidden on them. So they might be valuable, which is need to be concerned by data analyzers.